The Randall Museum in San Francisco hosts a large HO-scale model railroad. Created by the Golden Gate Model Railroad Club starting in 1961, the layout was donated to the Museum in 2015. Since then I have started automatizing trains running on the layout. I am also the model railroad maintainer. This blog describes various updates on the Randall Museum Model Railroad and I maintain a separate tech blog for all my electronics & software not directly related to Randall.
2022-01-11 - Train Vision Detection and Perfetto Tracing
Category RandallBack in November, I did a major update to the Vision software that drives the Vision computer at the museum for the Train Vision Project. A major issue was the image detection had a lot of false triggers and would erroneously detect a change in the image when there was no motion. I reworked the image analyzer, and I also added logging to capture what motion is detected. The logging system dumps data to a JSON file compatible with the chrome://tracing protocol and the Perfetto web UI, which I can then collect remotely and analyze later.
Here’s an example of run from last Saturday:
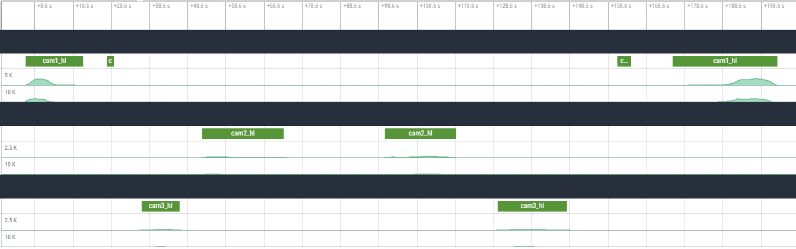
What we see above is an automated run from the mainline Freight train. Rows represent cameras 1, 2, and 3 respectively. Let’s look at camera 1 in detail:
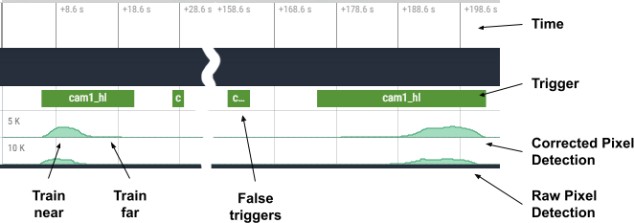
Starting at the bottom, we have the two pixel detection lines. This counts how many pixels change in an image. At time +8s, as the train comes into the image, we have a large “volume” of pixels changing, and as the train moves away from the camera, the pixel count gets smaller and smaller. Later, around time +170s, the train comes back and the pixel motion gets progressively larger as the train approaches the camera.
Thus we have these little “mountain” patterns and they are composed of two parts, with a large bump as the train near generates a lot of pixel motion, and a flat tail as the train far away generates little pixel motion; yet that “flat” part is quite relevant and still needs to be detected.
When looking at the bottom line, the raw pixel detection, it’s really hard to even see that “flat” part where the train is moving but far away. To account for that, I take a first order derivative, and then I smooth that with a 1-second average window. That gives us the “corrected” pixel motion detection, which is more stable and easier to analyze using a basic threshold.
The middle line with the square boxes labeled “cam1_hl” (for “camera 1 highlight”) indicates when the algorithm decided there was enough movement detection to feature an actual motion trigger and display the corresponding video. Here we see the large boxes left and right match the actual train movement, and the two small boxes (around times +25s and +160s) are just false triggers.
False triggers are what I really tried to address. Before, the thing was littered with them. I found out the RTSP stream I get from the cameras is of mediocre quality and often I get entire images that are distorted or half drawn. Luckily these result in huge spikes of pixel “motion” changes so I can filter them out. There are still a few mirror false triggers, however they are relatively minor and short.
The other realization is that camera placement matters a lot:
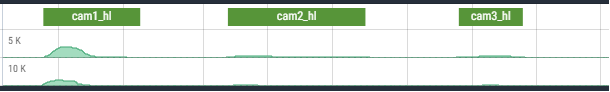
This is the same train as seen by these cameras. Due to the perspective, the amount of pixel motion detected changes drastically with the distance. So even with “full view” of the train, cameras 2 and 3 have much lower thresholds than camera 1. That also means noise in the video feed is potentially a larger problem with these cameras.
However what I had seen is that noise is very short and transient, occurring only in a few frames here and there. The combination of the delta and the window average filters it out neatly in most cases. I was envisioning using an adapting learning algorithm to figure the ideal threshold detection values, yet right now the system is stable enough not to need that extra complexity.