The Randall Museum in San Francisco hosts a large HO-scale model railroad. Created by the Golden Gate Model Railroad Club starting in 1961, the layout was donated to the Museum in 2015. Since then I have started automatizing trains running on the layout. I am also the model railroad maintainer. This blog describes various updates on the Randall Museum Model Railroad and I maintain a separate tech blog for all my electronics & software not directly related to Randall.
2026-02-18 - DCC Power Usage, and Boosters Mystery
Category RandallNow that I have a way to remote turn off power on the layout in case of emergency, I also have a way to measure the power consumption of the NCE Command Station and its boosters. The results are in after a few days:
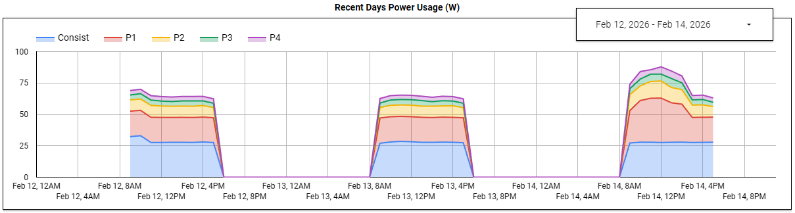
During the week with automation turned on, the layout consumes a bit less than 70 W.
That breaks down as 30 W for the automation computer, 20 W for the NCE Command Station, 9 W for Booster P2, 4 W for Booster P3, and 3.5 W for Booster P4.
On the graph above, the last day is a Saturday. When the Saturday Operators are running their trains, the layout uses more power. A typical HO engine consumes about 1 W per engine, and long trains often have 2 or 3 engines.
So now we get to “Booster Mystery”, or my repeated claim that the electrical system on this particular layout makes no sense whatsoever.
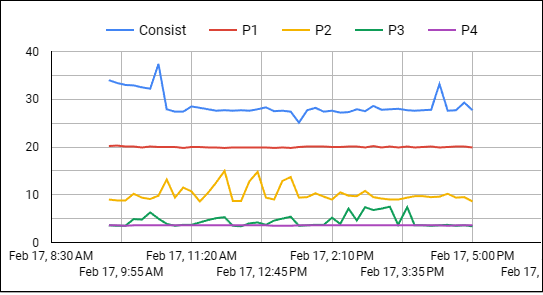
Here’s the Watt consumption graph for a typical automation day:
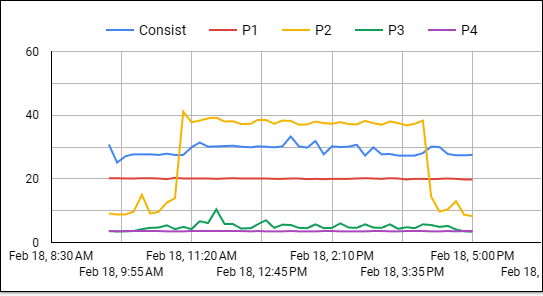
and here’s the Watt consumption graph for a specific day where an engine was shorting the layout:
Both are actually a bit unexpected:
- The blue curve is the computer’s consumption. It’s fairly constant, that’s fine.
- The red curve is the NCE Command Station. That one is very neatly constant too. That also powers the Valley 1 blocks (unused during automation days), and the Stockton Yard where we have a number of engines parked on tracks turned off. Overall, that’s fine.
- The yellow curve represents Booster P2. It powers Valley 2 blocks (also unused during automation days), as well as the Napa yard, Lodi, and Fairfield areas, which also see no movement during automation days. Why is that booster’s consumption changing during the day? On the first curve it corresponds to engine movements on the mainline which is powered by booster P4. We’ll discuss the 2nd curve below.
- The green curve represents Booster P3. That’s Mountain 1 blocks (also unused during automation days) as well as the Branchline -- that one has an automated line.
- Finally the purple curve represents Booster P4. That powers Mountain 2 blocks, and Stockton Station, and these contain every single block used during automation. Every. Single. One. Why is that one so flat and minimal? It should be one with the most consumption and the most variation!
Update 2026-02-23: The P2 / P4 mystery got easily resolved… I had the plugs inverted on the power strip, so I had the measures for P2 and P4 inverted. This makes more sense: the graph above means the yellow curve is the Booster P4, which has the most blocks used by the automation. I’ll update the text below to match the real P2 and P4.
Now let’s discuss that second graph. On February 18, the mainline UP engine started derailing. It stopped on block B321, shorting the power district. Block B321 is part of the Mountain 2 panel, covered by booster P4. At the end of the day, the graph showed a peak in the yellow curve (booster P4), which is what was expected.
Side Note: that yellow P4 curve on the second graph very clearly explains why shorts are deadly for DCC decoders. We run an NCE Booster, which can provide 5 Amps @ 12 V so about 60 W normal. It has its own over-current protection. Then we isolate power districts using NCE EB1 circuit breaker boards, each with their own over-current protection circuitry. Yet, what most people forget is that the circuit breakers are not designed to safeguard DCC decoders -- they are designed to protect the boosters! They do so by detecting high current usage (shorts) and very quickly kill the output track power, then they regularly “pulse” it back to see if the short has been resolved. From a DCC decoder point of view, that’s the equivalent of turning them on and off every few seconds, for hours. It’s not kind to such delicate electronics. |
The next day, the same engine failed at the same spot -- that’s when I went to investigate, found the issue, and fixed the track. And I also did another experiment:
- The engine was shorted on B321 (which should be powered by booster P4).
- Booster P4 consumption shot up from 8 W to 40 W.
- Booster P3 consumption was still in its usual 4~5 W range.
- Booster P2 consumption was still at its usual 3.5 W.
- I turned off power to booster P4.
- Booster P4’s light was still lit up even though its power plug was disconnected?!
- Suddenly, booster P3 started to consume 20 W!
- Booster P2 consumption was still at its usual 3.5 W.
- I turned off power to booster P4 and P3.
- Booster P4 and booster P3 lights finally turned off.
- Booster P2 still did not show any increase in consumption and stayed constant at 3.5 W.
- But in all cases, there was effectively no power on block B321. So where was this extra power consumption going for P3 and P4?
I do not have any kind of explanation. It seems like there’s some kind of connection between booster P3 and P4, but how? That would totally negate the principle of isolation that “power districts” are supposed to bring! The entire thing makes no sense whatsoever.
Now that is not a shocker, as that was precisely the thought behind the bizarre link I noticed with the Richmond Yard (booster P3) affecting the track sensors on the Mountain 2 panel (booster P4). See here for a detail on this weird incident:
https://www.alfray.com/trains/blog/randall/2024-11-19_richmond_yard_panel_and_moun_a8d081ac.html
That issue still exists as I was unable to find any tangible connection between both. I can’t fix stuff that I cannot fathom.