Model Train-related Notes Blog -- these are personal notes and musings on the subject of model train control, automation, electronics, or whatever I find interesting. I also have more posts in a blog dedicated to the maintenance of the Randall Museum Model Railroad.
2025-08-23 - Wazz Web Dashboard Update
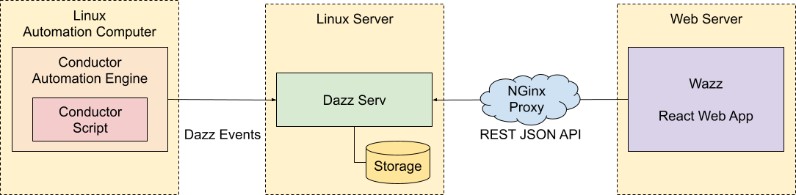
Category Train“Wazz” is my own web-based dashboard to get an instant overview of the automation at the Randall Museum Model Railroad. Last month, I started revamping the web site with a more modern implementation, and after about a month of work, I’ve just finished this major rework on the status dashboard with the following architecture:
This now results in a web page giving a dashboard like this:

This page gives me an overview of which computers are on, wherever the automated lines are active (the “toggles”), and which train ran last, and whether it completed its run properly.
The major visible part is this new “performance” tab that lets me see how the trains behave on their respective route:
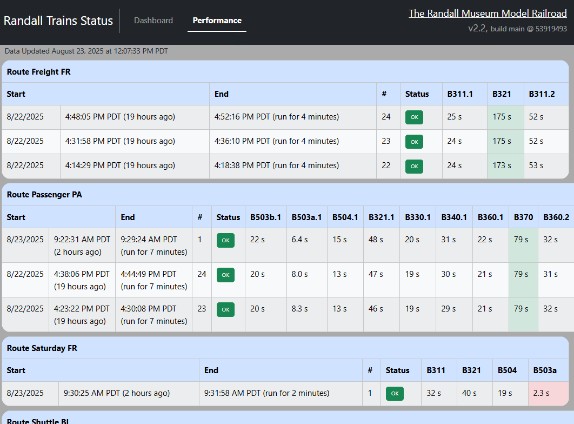
For each block, the automation keeps track of the time the train should spend in that block -- there’s a minimum time, a maximum, and the performance tab shows a color based on the “ideal” time spent in each block:
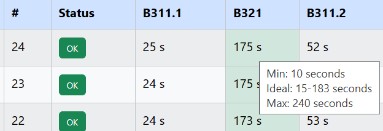
That allows the automation to detect anomalies as soon as possible. If a train spends too long in a block, that means either the engine has a problem or maybe it derailed and it’s not moving. The minimum timing also detects anomalies -- since the trains move at a very specific speed, they can’t magically cross a block too fast. Since we rely on electrical detection of the train in a block, that’s generally the sign there’s a problem with a sensor or a train that derailed and shorts the track for example, among other possible causes. In any case, the automation program will automatically stop the current train and attempt to do a “recovery” where it runs another program to bring the train back to the station.
It used to be that I needed to carefully go through the automation logs to figure issues after the fact. I still expect to do that in specific situations. However, the dashboard “performance” page above should help with the most common cases by directly highlighting where a train has performed out of its expected timing range.
That said, the web page dashboard is only the tip of the iceberg, and updating the dashboard web site was the easiest part.
The real magic starts by an update to the Conductor Automation Script Engine. The script language gets a new “dazz event” command that lets the script register any kind of event to be reported to the dashboard. This is used, for example, to keep track of the automation toggles on the main control panel, and the latest script_v35 uses it as such:
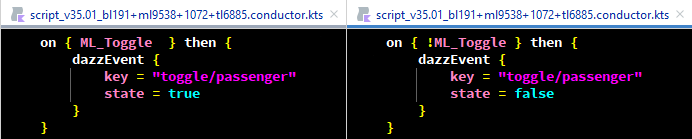
This allows the automation script to dictate which events get reported and collected, instead of just hardcoding them in the Conductor program. Right now I only collect when computers turn on and off, and when the automation is started or stopped -- which happens automatically when the museum staff turns the exhibit on and off, but can also be the result of the Saturday Operators manually turning the system on and off.
The other part of the Conductor script engine is the SequenceRoute class. This is the core route management that drives a train through a defined route, and it has been updated to emit route statistics when a train starts and when a train ends its route:
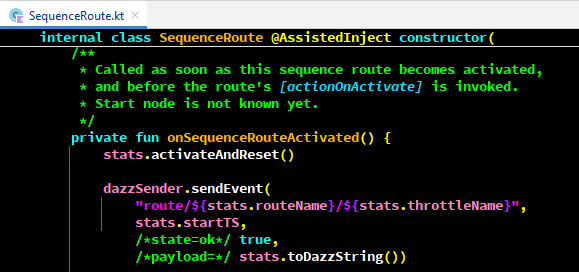
That one is a bit more interesting because we have 3 cases:
- A route starts, e.g. in our case a train is leaving the station. We want to collect an event indicating a train started running. We have its start time only.
- A route ends normally, meaning the train travelled through its entire route as expected -- in our case, the train has returned to its station. In this case, we want to update the same event to indicate the train route has ended; we now have an end time, and we also collect the time spent by the train on every single block that it travelled.
- A route ends with an error, meaning there was an issue and the train never finished its route. We also want to update the event, this time collecting an error indication, as well as the list of all the blocks traveled by the train.
The only other kind of route handled by Conductor are “idle routes”, which denote a train sitting idle e.g. at a station waiting to leave. These don’t have any events associated with them for now.
Finally, the other interesting part of the work was the piece “in the middle”: we have Conductor emitting events, and we have a web site that needs to collect event statistics from some place… That’s where DazzServ comes in, a small server running on the local network and accumulating all these statistics and events, to serve them later to Wazz.
For the Dazz implementation, I considered a few options. Maybe some cool hype stuff in Rust, or a server framework like Ktor and Netty? After considering a few options for the Dazz implementation, I threw all these choices away and opted for something fairly classic: it’s a simple Jetty REST server written in Kotlin, and using Gradle, Dagger and JUnit4. The server has a minimalist REST API and JSON payloads. It’s a 100% no-hype implementation, it works well, I’ve used all of these before so I know the APIs well, and it’s rock solid. Low learning curve, and, most importantly, very easy to maintain later. I run it locally on one of the layout’s Linux computers with a simple Debian systemd service.