The Randall Museum in San Francisco hosts a large HO-scale model railroad. Created by the Golden Gate Model Railroad Club starting in 1961, the layout was donated to the Museum in 2015. Since then I have started automatizing trains running on the layout. I am also the model railroad maintainer. This blog describes various updates on the Randall Museum Model Railroad and I maintain a separate tech blog for all my electronics & software not directly related to Randall.
2025-08-23 - Dashboard Update
Category RandallA lot of the work I do on the layout and its automation has to do with maintenance and “invisible” infrastructure -- things people don’t see at all, but keep the entire thing running. In software development, we call these tasks “KTLO” (a.k.a. “Keep the Lights On”). Part of the invisible part of the Randall Model Railroad Automation is all my remote monitoring of the automation. I can keep track of what the trains are doing, if they are doing it properly, with notifications when things don’t run as planned, and I can (in a limited fashion) remotely operate the trains if needed.
As such, I spend about the last month working on an entire new dashboard infrastructure, which results in a web page giving a dashboard like this:
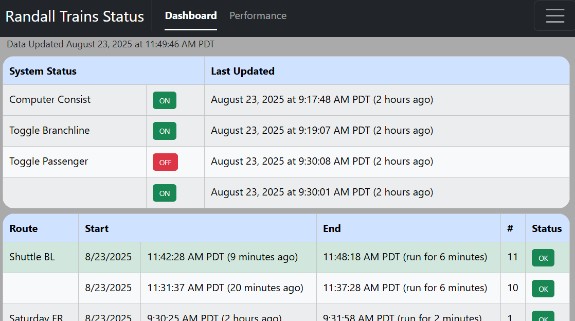
This page gives me an overview of which computers are on, wherever the automated lines are active (the “toggles”), and which train ran last, and whether it completed its run properly.
I recently expanded that dashboard with a “performance” tab that lets me see how the trains behave on their respective route:
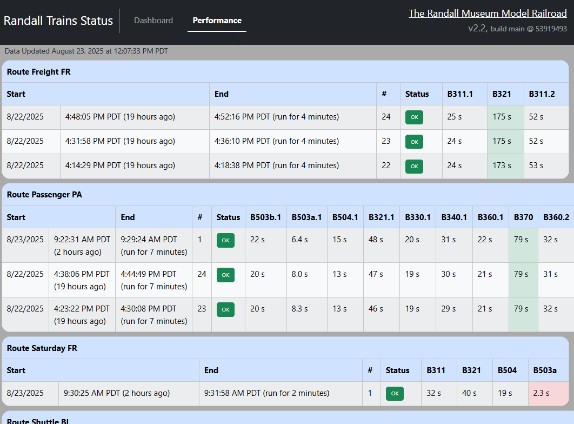
For each block, the automation keeps track of the time the train should spend in that block -- there’s a minimum time, a maximum, and the performance tab shows a color based on the “ideal” time spent in each block:
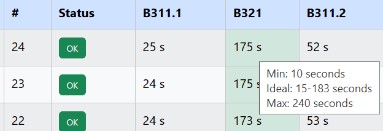
That allows the automation to detect anomalies as soon as possible. If a train spends too long in a block, that means either the engine has a problem or maybe it derailed and it’s not moving. The minimum timing also detects anomalies -- since the trains move at a very specific speed, they can’t magically cross a block too fast. Since we rely on electrical detection of the train in a block, that’s generally the sign there’s a problem with a sensor or a train that derailed and shorts the track for example, among other possible causes. In any case, the automation program will automatically stop the current train and attempt to do a “recovery” where it runs another program to bring the train back to the station.
It used to be that I needed to carefully go through the automation logs to figure issues after the fact. I still expect to do that in specific situations. However, the dashboard “performance” page above should help with the most common cases by directly highlighting where a train has performed out of its expected timing range.
The web page dashboard is only the tip of the iceberg. There’s a lot more to making this happen than just displaying the data. Obviously it needs to be collected in the first place. For more detail, please continue reading here.